Statistics 1 · Year 7
Data Language Foundations
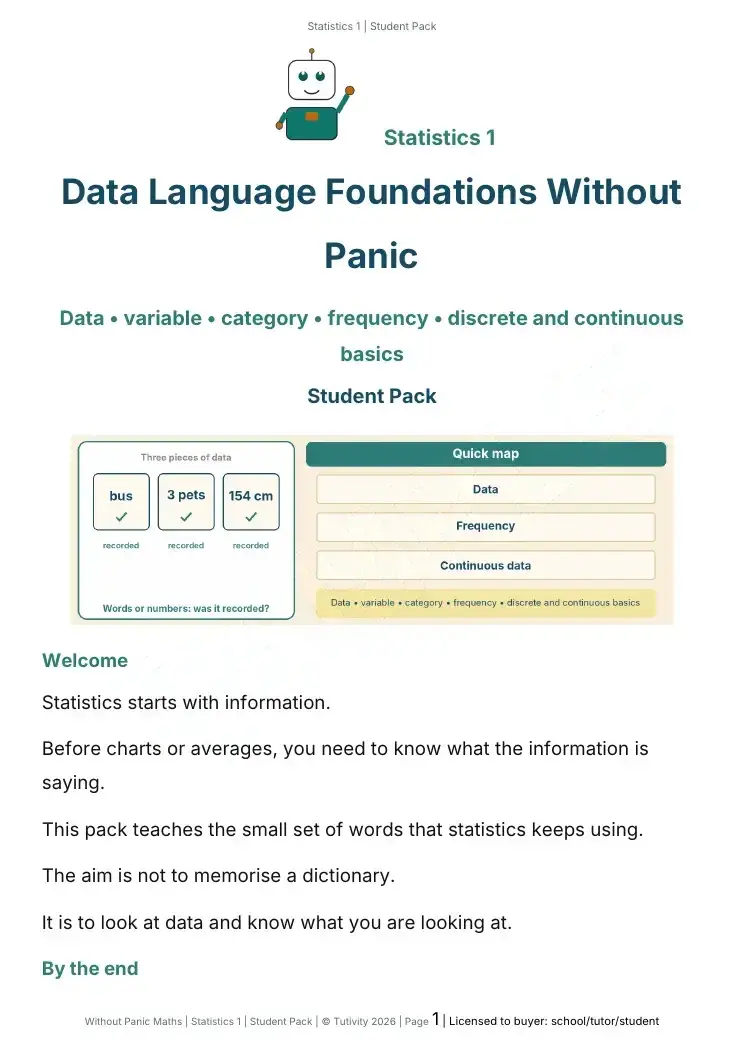
Statistics starts with information. Before charts or averages, you need to know what the information is saying. This pack teaches the small set of words that statistics keeps using.
Free
Without Panic Maths · Statistics 10
This pack follows Statistics 9. You learn that the whole circle is 360°, turn shares and frequencies into sector angles, check that the angles make 360°, and draw accurate pie charts with a protractor.
What this pack does
This pack follows Statistics 9. You learn that the whole circle is 360°, turn shares and frequencies into sector angles, check that the angles make 360°, and draw accurate pie charts with a protractor.
Inside every pack
Pupils tick how a topic feels before they start, and again at the end. There are no marks, so it's an honest picture of where they are.
Each topic is split into small steps. Every mini-lesson opens with one big idea and a short, plain-English explanation.
Diagrams such as a formula 'rule machine' or a place-value picture show the maths, so pupils can see it as well as read it.
Every method is modelled step by step before pupils try it, with each stage labelled so they can follow it on their own.
Questions start with prompts (what do you need to find, follow the example, check it makes sense) and gradually ask for more independence.
Common mistakes are named before pupils make them, and Mistake Detective questions ask them to find and fix errors.
Short 'explain it in your own words' prompts check that pupils understand why the maths works, not just how.
Every pack comes with a Teacher Pack: all the answers, plus reteach cards saying what to watch for, what to say, and what to try if a pupil is still stuck.
More statistics packs
Statistics starts with information. Before charts or averages, you need to know what the information is saying. This pack teaches the small set of words that statistics keeps using.
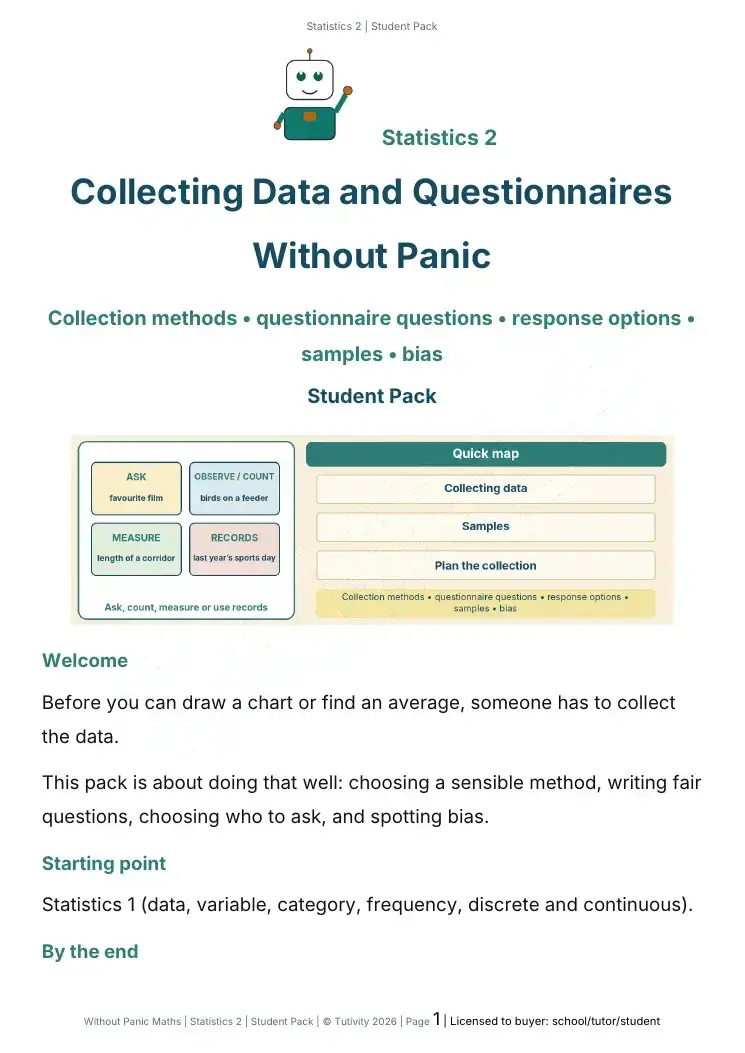
Before you can draw a chart or find an average, someone has to collect the data. This pack is about doing that well: choosing a sensible method, writing fair questions, choosing who to ask, and spotting bias.
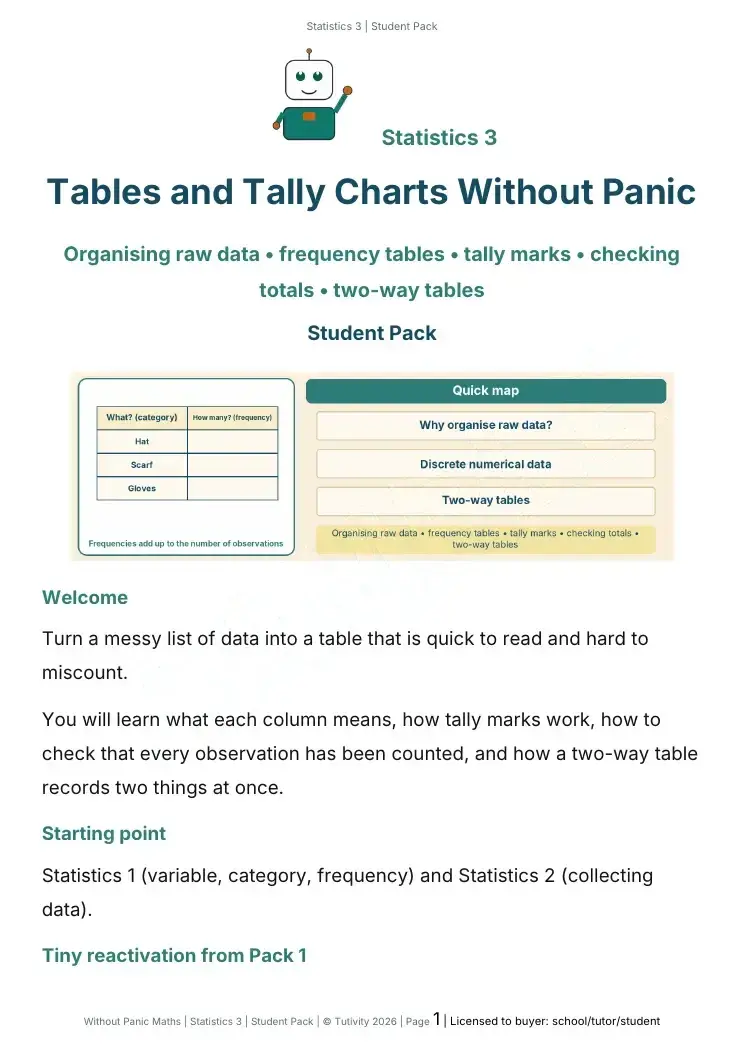
Organising raw data • frequency tables • tally marks • checking totals • two-way tables